AI Checker
Plagiarism Checker
Grammar Checker
Content Quality
Guideline Checker
Readability Checker
Fact Checker

Chrome Extension

Twitter’s X rebrand may have felt shocking at the time, but it certainly didn’t mark the end of the platform. If you want to know who’s still on X, what they’re using it for, and whether or not it’s worth including in your marketing strategy, these 20+ X/Twitter statistics for 2026 are for you.
We’re skipping the vanity metrics and going straight to what matters.
Source: DataReportal
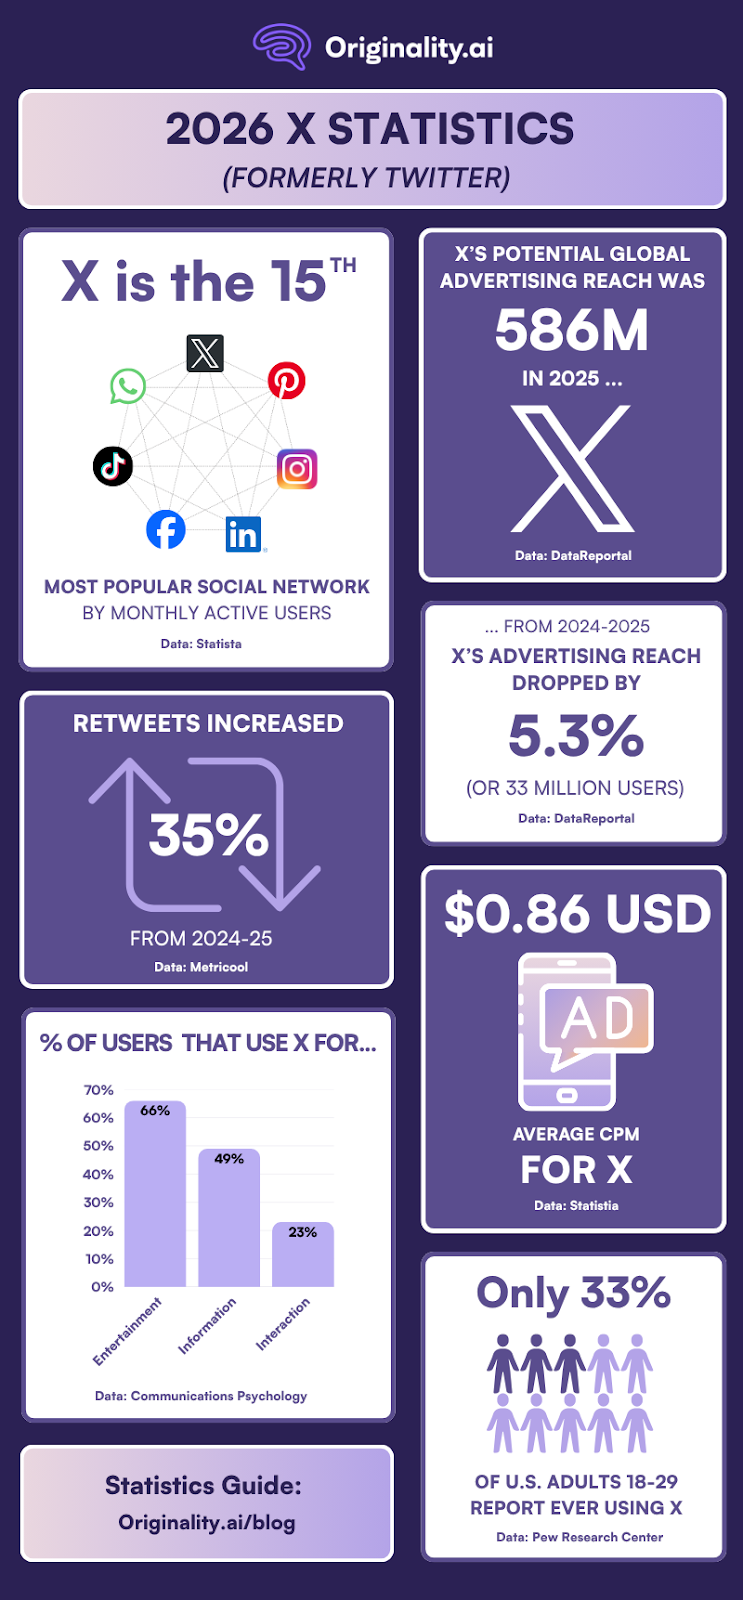
Despite Forbes reports that X “has been bleeding users”, the platform is far from dead. If you’ve been ignoring X ads (considering they still reach over 500 million), you may be missing the chance to reach a good chunk of your audience.
Source: DataReportal
Sure, there are still lots of users, but losing 33 million potential eyeballs from January 2024 to 2025 is a considerable drop. The move here may be to take advantage of the reach while it’s still this high, but keep an eye on things. Make sure the results justify your ad spend.
Source: Statista
It’s not the biggest social network by a long shot, but it’s still attracting hundreds of millions of active users each month (557 million as of October 2025). In other words, it’s still worth your time, it's just not as popular as other platforms like Meta’s Facebook (3+ billion monthly users as of October 2025).
Source: Similarweb
Yes, X has global reach, but the U.S. alone drives over a quarter of the traffic as of March 2026. There’s a steep dropoff after that, with Japan coming in second at almost 12%, and the UK in third at around 4%.
This may be great news if you’re after an American audience, but it can make things more difficult for other markets. To get your posts seen by a global audience, it could help to be more intentional about language and even posting times.
Source: Statista
Pew Research published similar findings to Statista for the gender demographics of X, with 25% of men vs. 16% of women in the U.S. saying that they use the X social media platform.
If you’re marketing to women, it may be better to focus efforts on different platforms such as Instagram (47.3% women vs. 52.7% men) or Snapchat (48.4% women vs. 50.7% men) (Stats from Statista).
Source: Pew Research Center
X is not the best place to be if you’re looking to reach a younger crowd. Those between 18 and 29 are more likely to report using YouTube (95%) or Instagram (80%), so focus your content there.
Source: DataReportal
You don’t need to treat X as a standalone platform if most of its users are also on Instagram, YouTube, and Facebook. Use it for what it’s good at (hooks, takes, sparking conversation, etc.), and plan cross-platform to meet your audience wherever they are that day.
Source: Pew Research Center
If you’re trying to reach affluent audiences, don’t sleep on X. Just make sure that your content is attention-catching by making it sharp, insightful, and actionable.
Source: Pew Research Center
In a 2025 survey of U.S. adults who said they used X as a social media platform, Pew Research found that 24% graduated from college, 23% attended some college, and 16% completed some high school or less.
Source: Communications Psychology
To stand out on X/Twitter try to create content that’s either entertaining or valuable (or both!), considering that the primary use case for X is entertainment, with information coming in second.
Source: Reuters Institute
This indicates that news content in particular isn’t showing much growth on X. In contrast the usage of Instagram for news content grew from 11% in 2021 to 16% by 2025.
Source: Similarweb
It’s not like people are bouncing (learn more about bounce rates) within seconds, but they’re not hanging around all day either. Make sure your posts are skimmable and have a clear hook to earn their attention.
Source: Metricool
With retweets up, it’s not just about getting people to tap “Like” anymore. Create content that people want to share and be associated with, and you may get your brand popping up in their followers’ feeds.
Source: Socialinsider
It’s not a huge slide, but it’s something to consider. If you’ve noticed something similar in your own metrics, it may be time to tweak your strategy, test it out, and keep what works.
Source: Buffer
It’s still text posts that get the most attention on X/Twitter; however, it may be worth including images and short video clips to gain more traction.
Source: Content Marketing Institute
X can still be useful, but if B2B teams report that LinkedIn (85%) and Facebook (28%) seem to give them the better ROI, it may better as a supporting channel. Prioritize the platforms that give you the best returns.
Source: WebFX
It could be worth testing some marketing budget on the platform if you’ve been spending less. Just be sure to track your results.
Source: Socialinsider
It’s hard to pinpoint exactly why viewership has jumped (possibly due to viral moments), but it’s good news for creators and brands. More views per post means more opportunities to get content in front of the right people.
Source: Metricool
95 posts a week is a lot, but it does increase your chances of reaching new users and boosting brand awareness if you have a huge 50k+ following. It could be worth boosting your posting frequency to see if it increases your follower count. However, remember to balance this with content value that catches the viewer’s attention and encourages retweets.
Source: Sprout Social
Across a wide range of industries, from fashion to nonprofits to sports to media and higher ed, the median engagement for X posts is 0.015%.
Source: Statista
For marketers running ad campaigns, CPM is a key metric to follow. On X CPM as of October 2025 was $0.86, notably lower than other social platforms such as Meta ($6.69 USD) and TikTok ($4.34 USD).
Looking at the Twitter/X statistics collected here, it’s clear that the platform has changed more than just its name and ownership in the past few years.
To make X work in 2026, treat it like the platform it is right now. Focus on creating entertaining, people-first posts, and customize content for the primary audience demographics on X in 2026.
Through it all, make sure your content feels authentic, hits fast, and says something worth sharing.
Want to make sure your next X post sounds human and not AI? Try the Originality.ai AI Checker today.
Further Reading:

AI & Plagiarism Detector for Serious Content Publishers
Originality.ai
64 Hurontario St
Collingwood, Ontario
L9Y 2L6