AI Checker
Plagiarism Checker
Grammar Checker
Content Quality
Guideline Checker
Readability Checker
Fact & AI Hallucination Checker

Extensions

Last month, we at Originality.ai revealed that more than one third of all Canadian real estate listings were likely written by AI.
We now have follow-up data to gauge the effectiveness of using AI in Canadian real estate listings, and can determine that likely AI-written listings sell an average of two days faster than their human-written counterparts.
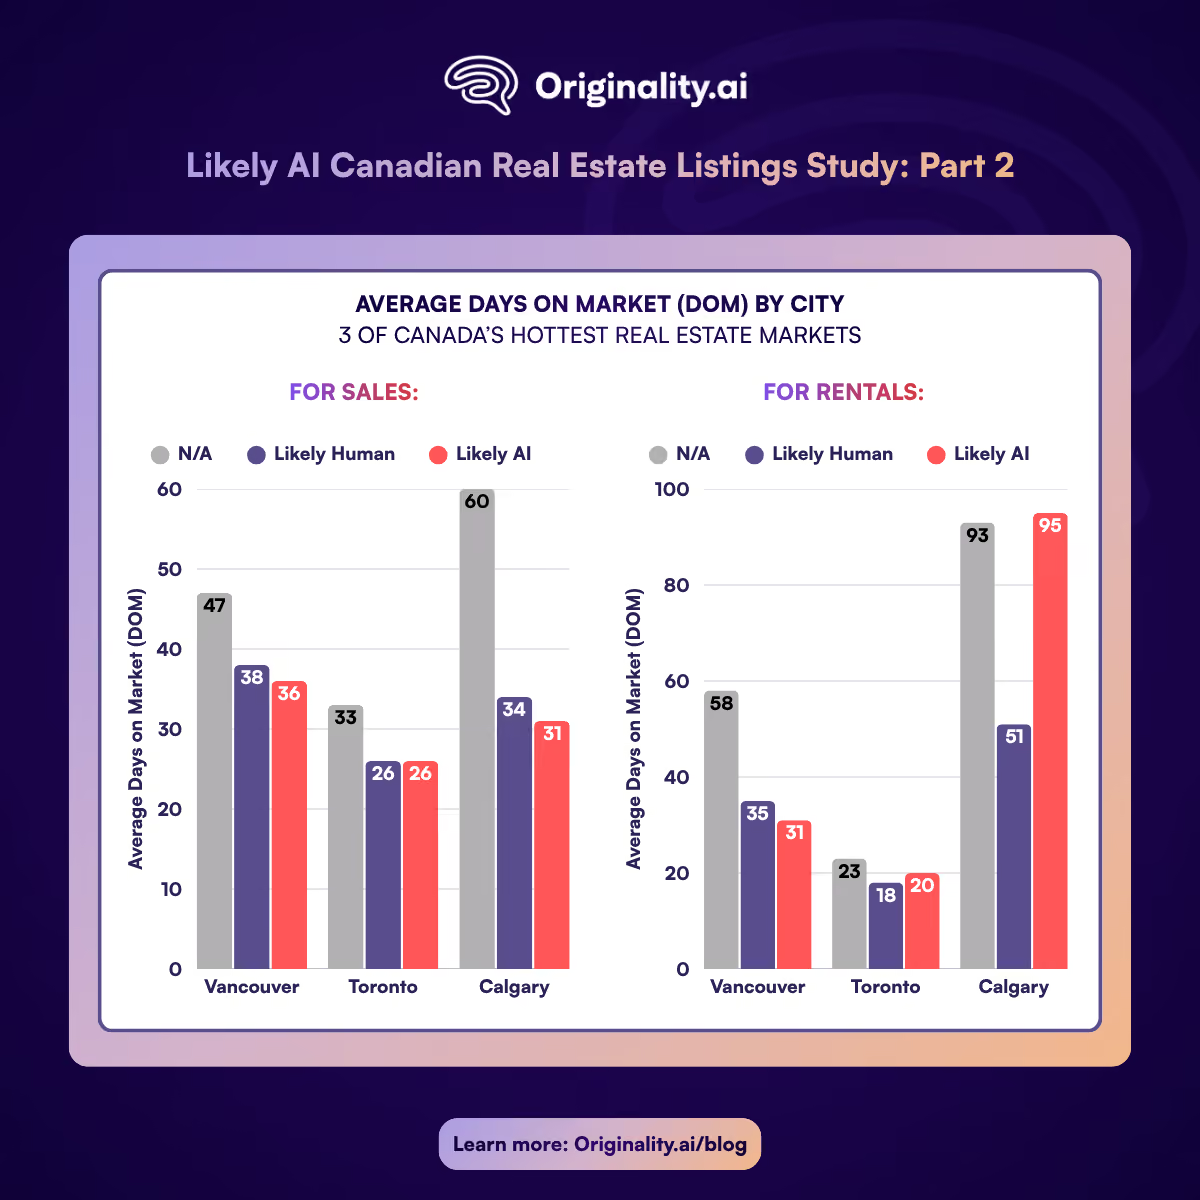
Check out the charts below to compare the average days on market for N/A, Likely Human, and Likely AI listings for three of Canada’s hottest real estate markets by sales and rentals: Toronto, Vancouver, and Calgary.
For the original study, we spent the first two weeks of May 2026 scanning every available real estate listing from a diverse range of Canadian cities: Toronto, Montreal, Vancouver, Mississauga, Surrey, Hamilton, Edmonton, Calgary, Quebec City, London, Winnipeg, Ottawa, Victoria, Halifax, Windsor, Moncton, Saskatoon, St. John’s, Charlottetown and Regina. That dataset included 72,047 total listings, spanning detached homes, condos, apartments, duplexes, triplexes and mobile homes.
We initially discovered that 37% of all listings were likely AI-written, with just 30% likely human-written. The remaining third, 33%, came back as N/A, due to the text descriptions falling below Originality.ai’s 100-word minimum for AI detection.
We found that Calgary was far and away the most prominent city for AI, with 70% of all listings flagged as likely AI-generated. The province of Quebec ranked lowest, with Montreal and Quebec City only seeing single-digit percentages, mostly due to those cities’ descriptions almost uniformly falling below our 100-word threshold.
From July 6-8, 2026, we redid our survey including all the same information, but on a smaller scale, to capture one additional data point: days on market (DOM). For this study, we looked only at three of Canada’s hottest real estate markets: Toronto, Vancouver and Calgary.
Our findings vis-a-vis AI likelihood were remarkably consistent with the original data from May 2026. AI likelihood in all three cities rose by exactly one percent: Calgary, from 70% to 71%; Toronto, from 39% to 40%; and Vancouver, 31% to 32%.
This points to the consistency of the data, as the empirical numbers grew across the board.
Calgary leapt from 3,020 total listings in May 2026 to 4,789 in July—a 59% increase in just two months. Yet the AI rate remained virtually identical. Vancouver rose from 8,491 to 9,029 listings, and Toronto rose from 15,558 to 16,077—both more modest increases.
(Note: this is not meant as a definitive capture of every listing within these cities; the longitudinal and latitudinal coordinates shifted between studies. The primary metro areas and some surrounding suburbs were included in both. These numbers should not be interpreted as representative of the entirety of these cities’ current housing stock. In other words, Calgary probably didn’t add 1,700 vacant housing units in two months—we just cast a wider net.)
The similarities in AI likelihood could be owing to an overlap in the datasets, but the new set has 2,826 more listings between these three cities (27,069 in May compared to 29,895 in July), creating enough of a buffer to challenge the AI likelihood rates. Instead, these additional listings had virtually no effect on AI likelihood.
In addition to the same parameters as the original study, we looked at Days on Market (DOM).
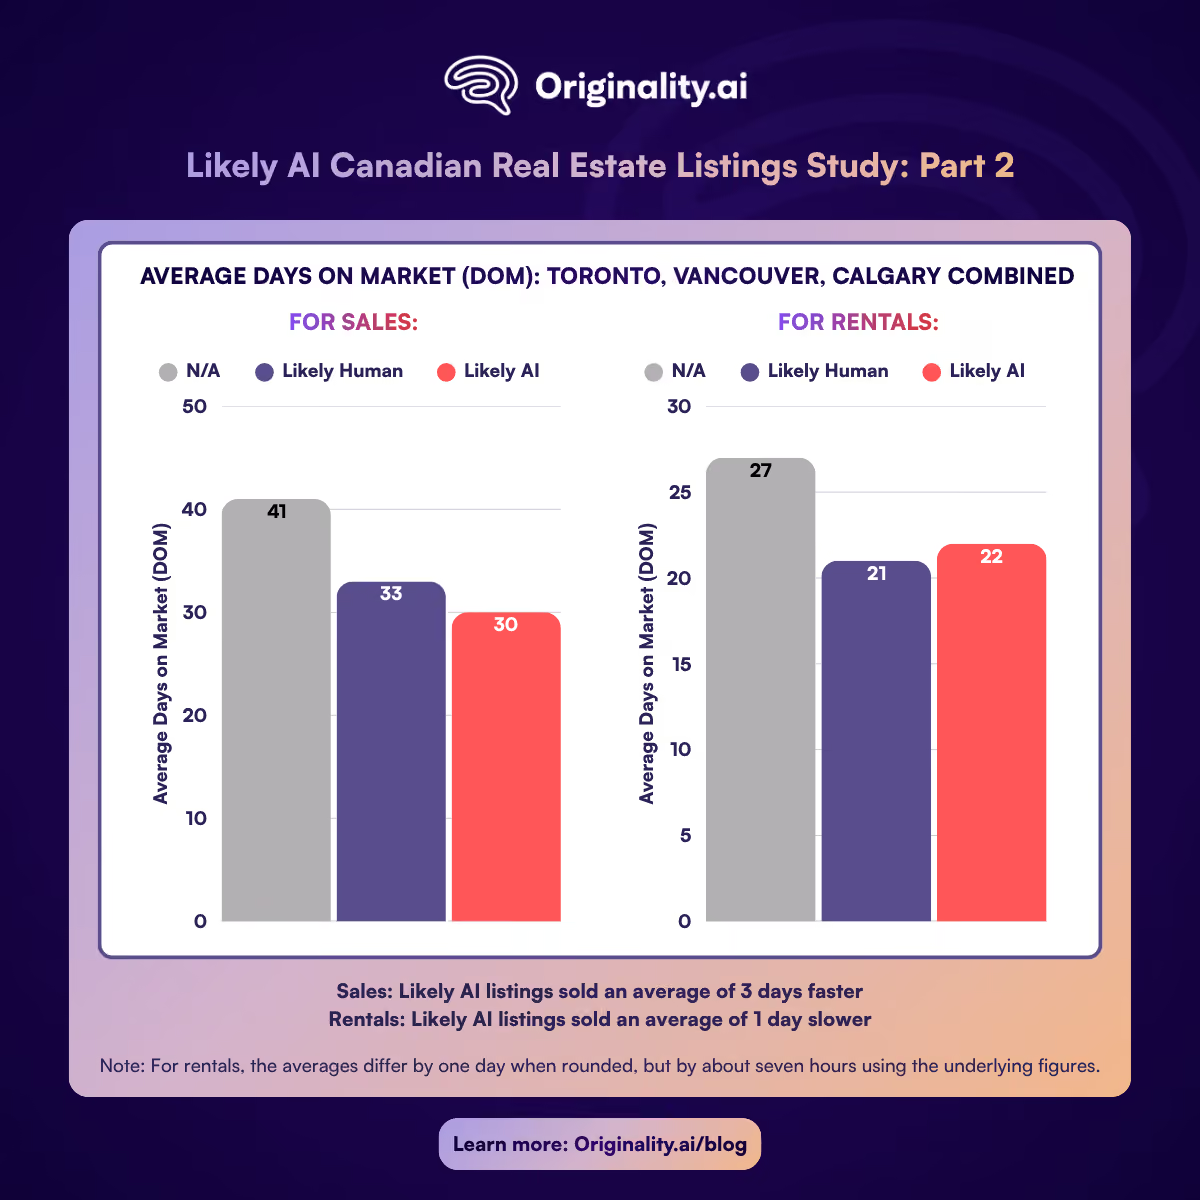
On the face of it, looking at DOM for Toronto, Calgary, and Vancouver combined, likely AI-written listings sold, on average, two days faster than likely human counterparts.
Let’s break down that average further by sales and rentals across the 3 cities studied:
So, for sales specifically, Likely AI listings sold about 3 days faster, while for rentals, Likely AI listings actually sold about 1 day slower.
Note: For rentals, the averages differ by one day when rounded, but by about seven hours using the underlying figures.
But we cannot definitively conclude that this means AI text has any bearing on the effectiveness or speed of a sale. The broader picture illuminates the situation.
To gain a clearer picture and reduce noise, we began by filtering out rental units to drill down on home sales, looking at DOM, average price, and the number of housing units.
The outlier across the board is the N/A category.
Listings that fell below Originality.ai’s 100-word threshold sat on the market for significantly longer.
In Calgary, N/A listings sat for nearly twice as long—60 days instead of 31-34. In Toronto, likely AI- and human-written listings held at exactly 26 days, while N/A rose to 33; in Vancouver, N/A listings averaged around 10 days longer on the market (47 days over 36-38).
So the real story may not be AI’s effect on DOM—it’s whether a fulsome description exists at all.
When isolating only rentals, the distinctions become sharper.
To start, Calgary must be discounted entirely. With only 25 rental units collected in this survey, there simply isn’t enough data to draw conclusive results.
Toronto has 6,970 rental units in this study, while Vancouver has 1,102.
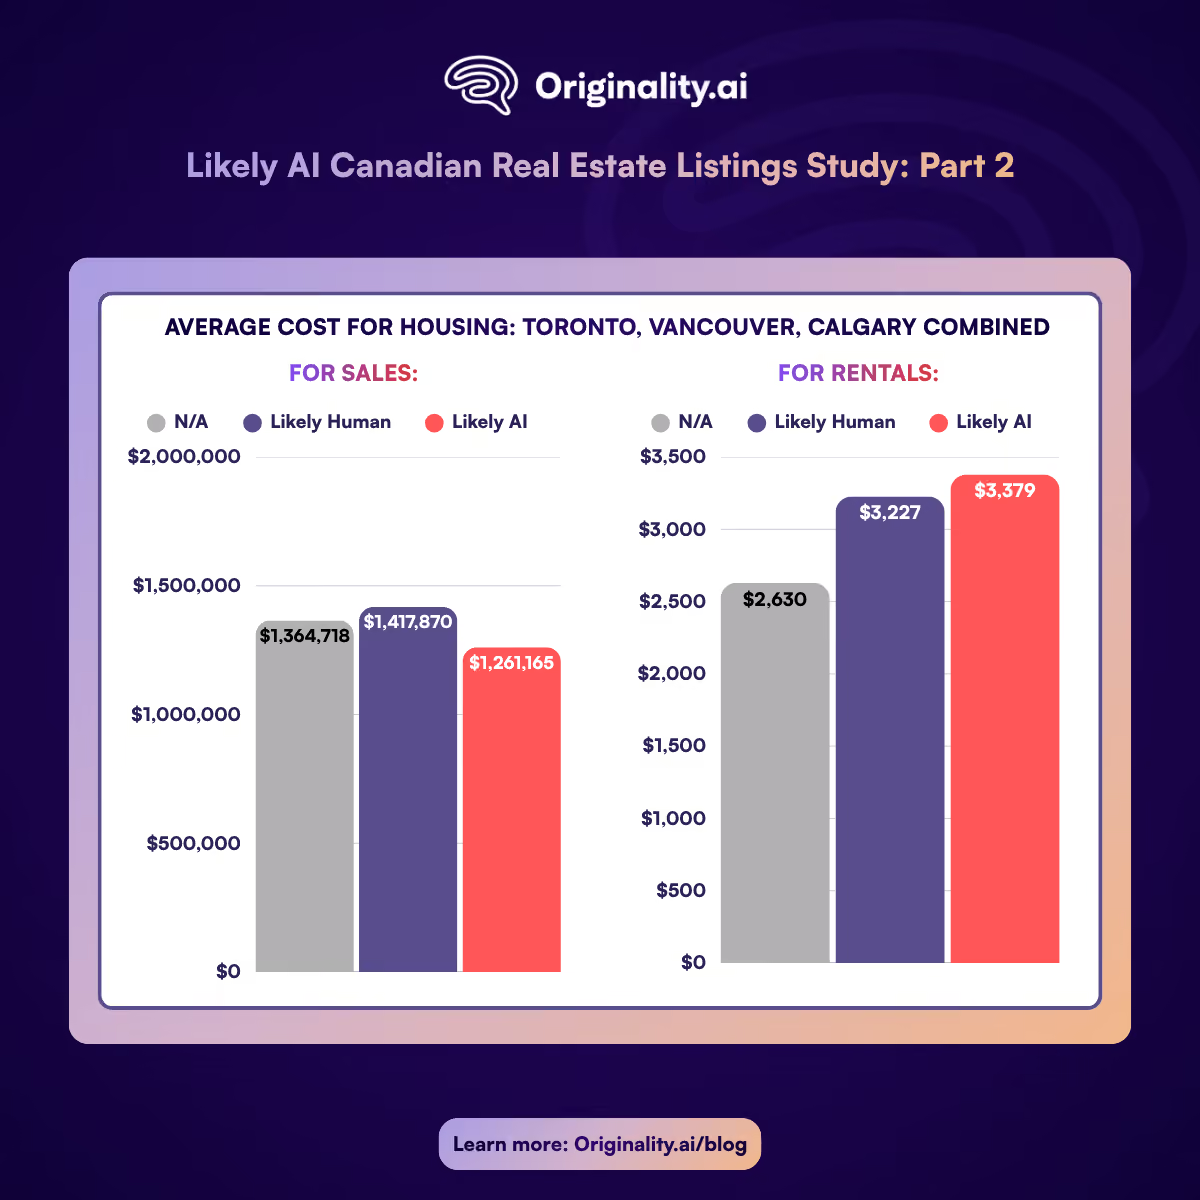
In both Toronto and Vancouver, about half of each city’s respective rental listings had too-short descriptions filling the N/A category. Those units’ DOM were longer (23 days in Toronto; 58 in Vancouver) than units with longer descriptions. The cost of those N/A’s was also noticeably cheaper in both cities: Vancouver’s were around $1,000 per month less on average than both likely AI- and likely human-written listings.
Once again, we can reasonably infer—without digging into every single listing—that these are cheaper, less desirable rentals, for which landlords didn’t bother writing long descriptions.
In both cities, likely AI- and human-written rental listings both stayed on the market for comparable amounts of time, and averaged nearly identical prices, separated only by a few hundred dollars per month on average.
This cements the earlier hypothesis: AI might move the needle a little in terms of DOM, but the real deciding factor is whether your description exists at all. This appears directly tied to the price and, presumably, quality of the unit itself.
Looking at other factors that affect DOM, the most obvious starting point is price.
Still filtering out rentals, in Toronto and Vancouver, the N/A’s were noticeably cheaper. Perhaps this points to fixer-uppers or units in undesirable neighbourhoods. Lower-effort listings, shorter descriptions and cheaper prices could all lead to lower days on the market. (Interestingly, in Calgary, N/A’s are actually more expensive, but there are only 124 such examples, compared with thousands of units for sale, so the data is less reliable.)
Turning to the likely use of AI, Vancouver and Toronto both have comparable numbers of housing stock, in the low-to-mid-thousands. The DOM for both likely AI- and human-written groups are similar—Toronto’s are identical at 26 DOM; in Vancouver, likely AI-written listings sell two days faster, in 36 days instead of 38.
Prices are consistent for both groups. In Vancouver, listings flagged as AI were around $7,000 cheaper in a city where the homes surveyed average more than $1.7 million. In Toronto, likely AI-written listings cost a bit more, around $60,000—but since DOM remains the same for both groups (26 days), the results are inconclusive.
In covering our original study, the Globe and Mail interviewed a Calgary-based realtor who said using AI saved her as much as 30 minutes in a process that normally takes as long as five hours. “It can really help me squeeze some time,” she said.
This focus on efficiency could be a clue as to the underlying reason that likely AI-written listings, across rentals and sales in all three cities, sell two days faster.
Perhaps it isn’t the language at all, but the time-savings that matters. If the aforementioned Calgary realtor saves 30 minutes by using AI to write her descriptions, she could well be using that 30 minutes to track down leads or respond to clients instead. Perhaps she uses AI to automate other tasks, or is primed to find efficiencies elsewhere in her daily workflow.
It would be a reasonable hypothesis that the real reason Calgary’s housing stock—when accompanied by likely AI-written listings—is $50,000 cheaper and sells three days faster has nothing to do with who or what wrote the words, and everything to do with the mentality of the realtor. Some realtors move quicker, price homes competitively, and work more efficiently than others.
After all, selling a couple of days faster for $50,000 less is a marginal improvement in the real estate industry. But saving around the margins is exactly where AI, as a complementary tool, can be most useful.
Read our initial study on the impact of likely AI content on real estate listings.
This study examined whether the use of AI-generated text in real estate listing descriptions correlates with time on market across three major Canadian cities: Toronto, Vancouver and Calgary. Listing data was collected via automated web scraping, descriptions were scanned using an AI detection tool, and Days on Market (DOM) was calculated from listing insertion timestamps. Results were analyzed in Microsoft Excel. Active for-sale and for-rent listings were collected, resulting in 29,895 total listings.
Listing data was sourced from July 6-8, 2026, from Realtor.ca, Canada’s national MLS database operated by the Canadian Real Estate Association (CREA). Data was accessed programmatically via the Realtor.ca Scraper API, a third-party API available through RapidAPI by ScrapeMind, which provides structured access to Realtor.ca’s property search and listing detail endpoints.
A custom Python 3 scraping pipeline was developed consisting of city-specific scripts. The pipeline first queried the /properties/search endpoint using geographic bounding box parameters (latitude/longitude min/max) derived directly from Realtor.ca’s own map interface for each target city. To ensure complete coverage within each market, cities were divided into spatial grids of between 4x4 and 5x5 cells depending on listing density, with each cell queried independently. Results were paginated at 12 listings per page until no further results were returned.
After collecting each MLS number in the first stage, the pipeline performed a two-step detail retrieval process. The /properties/details endpoint was first queried to retrieve the internal PropertyId for each listing. This PropertyId was then passed alongside the MLS number to the /properties/details/v2 endpoint, which returned the full listing description (the PublicRemarks field) along with supplementary fields including property type, price, address, and listing timestamps.
All data was written incrementally to a city-specific SQLite database file, with each listing committed immediately upon retrieval to prevent data loss in the event of interruption. Completed grid cells were logged to allow resumable runs.
Days on Market (DOM) was calculated from the InsertedDateUTC field returned by the /properties/details/v2 endpoint, which records the UTC timestamp, at which a listing was first entered into the Realtor.ca system. This timestamp is encoded as a .NET ticks value (100-nanosecond intervals since January 1, 0001) and was converted to a calendar date in Python. DOM was then calculated as the difference in days between that listed date and the date of data collection.
Listing descriptions were bulk scanned using Originality.ai, one of the world’s leading AI-detection tools. Descriptions containing fewer than 100 words were excluded from detection analysis, as they fall below the tool’s minimum threshold for reliable scoring. Each scannable description received a probability score from 0 to 100, with results classified as “Likely AI” (score ≥ 50) or “Likely Human” (score < 50). Listings with descriptions below the word threshold were retained in the dataset and classified as N/A.

AI & Plagiarism Detector for Serious Content Publishers
Originality.ai
64 Hurontario St
Collingwood, Ontario
L9Y 2L6