AI Checker
Plagiarism Checker
Grammar Checker
Content Quality
Guideline Checker
Readability Checker
Fact Checker

Chrome Extension

Artificial intelligence has been affecting workflows across virtually every industry for the last several years. In real estate, AI is being used for backend administrative work like lead generation and conversion, predictive analytics, email marketing, and valuation reports—tasks about which no prospective homebuyer is likely to notice or complain.
But when it comes to public-facing content—like virtual staging, AI-edited images, or AI-written descriptions—the ethical boundary becomes blurrier. Realtors are not necessarily gifted writers or photographers; it’s understandable why they might turn to AI for help selling their listings. But the depictions must match reality, and transparency is paramount.
To better understand this shift in market practices, we at Originality.ai spent the first two weeks of May 2026 scanning every available real estate listing from a diverse range of Canadian cities: Toronto, Montreal, Vancouver, Mississauga, Surrey, Hamilton, Edmonton, Calgary, Quebec City, London, Winnipeg, Ottawa, Victoria, Halifax, Windsor, Moncton, Saskatoon, St. John’s, Charlottetown and Regina. The dataset includes 72,047 total listings—15,735 rentals and 56,312 sales—including detached homes, apartments, duplexes, triplexes, mobile homes, and more.
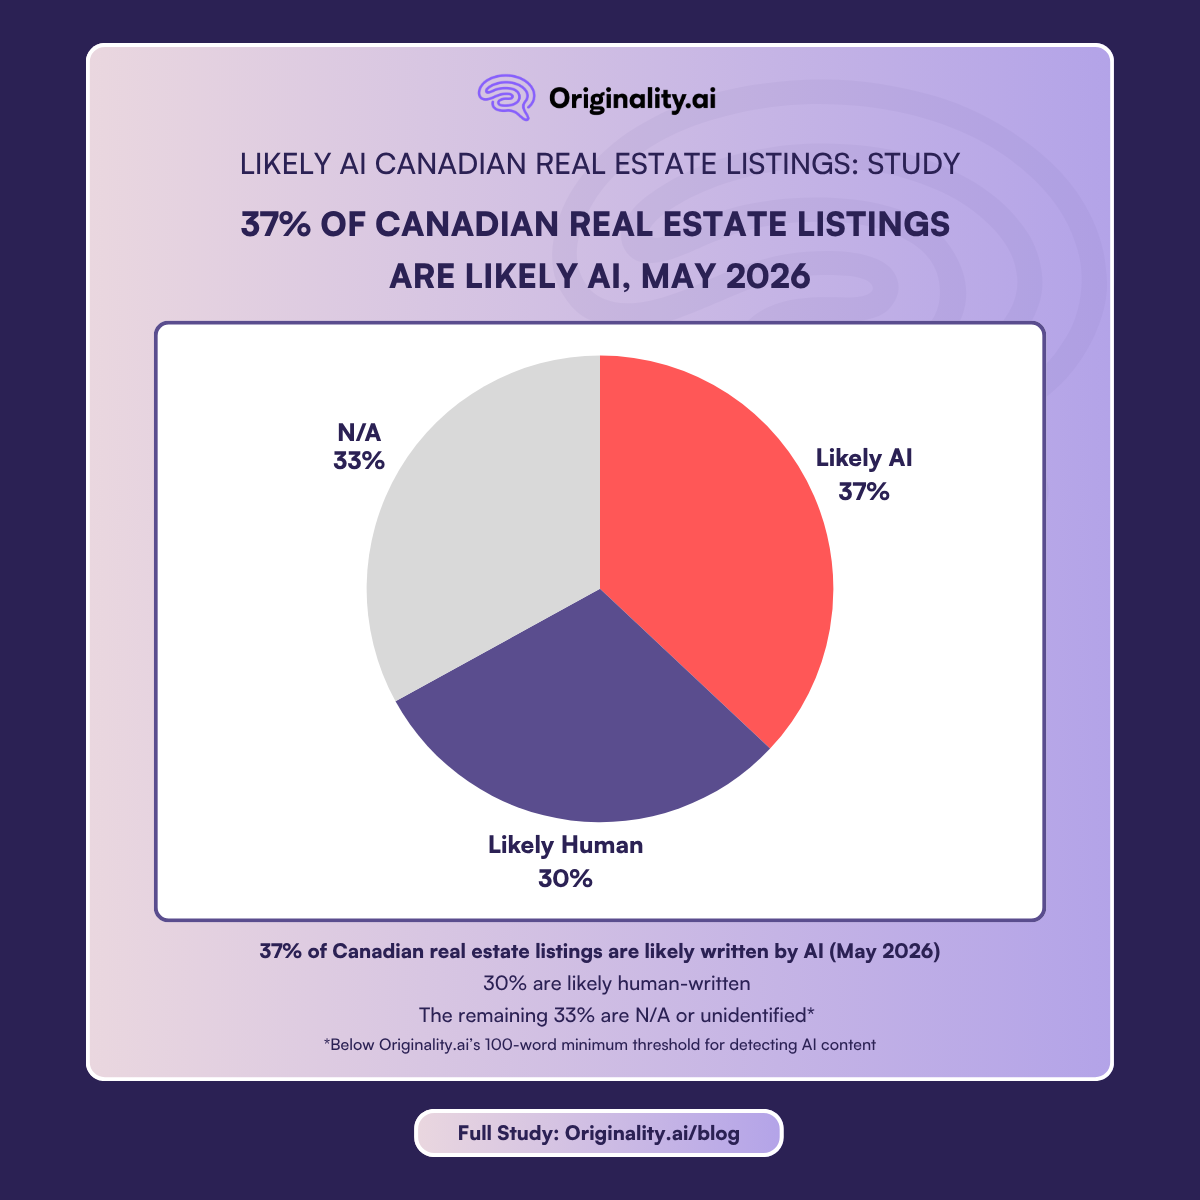
According to our research, more than one-third of all Canadian real estate listings were likely written by AI.
For this study, we looked at 20 cities across Canada, including at least one in every province. Rather than only looking at the most populous metro areas, we opted to cast a wide net geographically.
This makes the sample size uneven if looking at absolute numbers—Toronto is the largest city in the dataset, with 15,558 listings; Regina is the smallest with 641—but it paints a national picture to better understand regional differences.
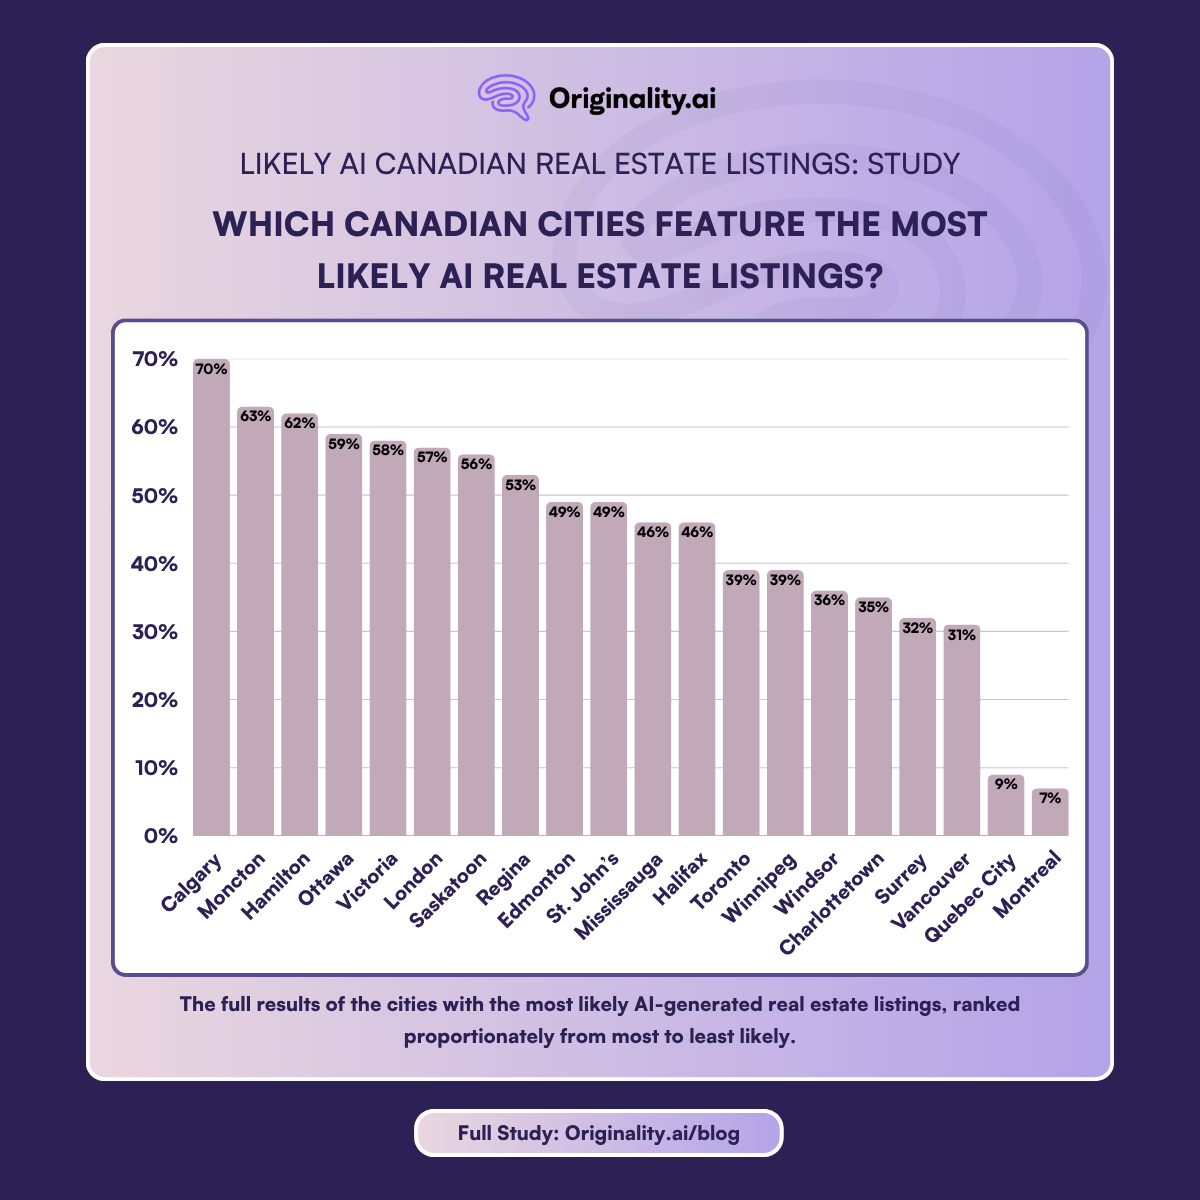
Here are the full results of the cities with the most likely AI-generated real estate listings, ranked proportionately from most to least likely:
A few regional differences do stand out.
The most obvious is Quebec: both Quebec City and Montreal have significantly fewer listings likely written by AI, and significantly more in the “N/A” category. This is largely because Quebec real estate listings are more succinct: in Montreal, more than 80% of listings were under 100 words.
This could be related to Quebec’s infamous language laws. Realtors writing only in English could face legal penalties if they advertise their listings in any language other than French—even on their own personal social media feeds.
As a result, they are perhaps more likely to keep listings as purely informational for non-French speakers—explaining to prospective Anglophones about the neighbourhood and amenities—rather than emotive.
Here’s a comparative article for additional context on the differences between Quebec and Ontario real estate, as an example.
Contrast this with Alberta, famous for its efforts to reduce red tape across a range of sectors. Alberta’s real estate market has:
While we cannot definitively correlate this to the fact that Calgary has far and away the highest proportionate use of likely AI-written real estate listings (70% of the 3,020 listings scanned), when put in contrast to Quebec, the coincidence is undeniable. Edmonton, at 49%, is tamer compared to Calgary, but still above the national average.
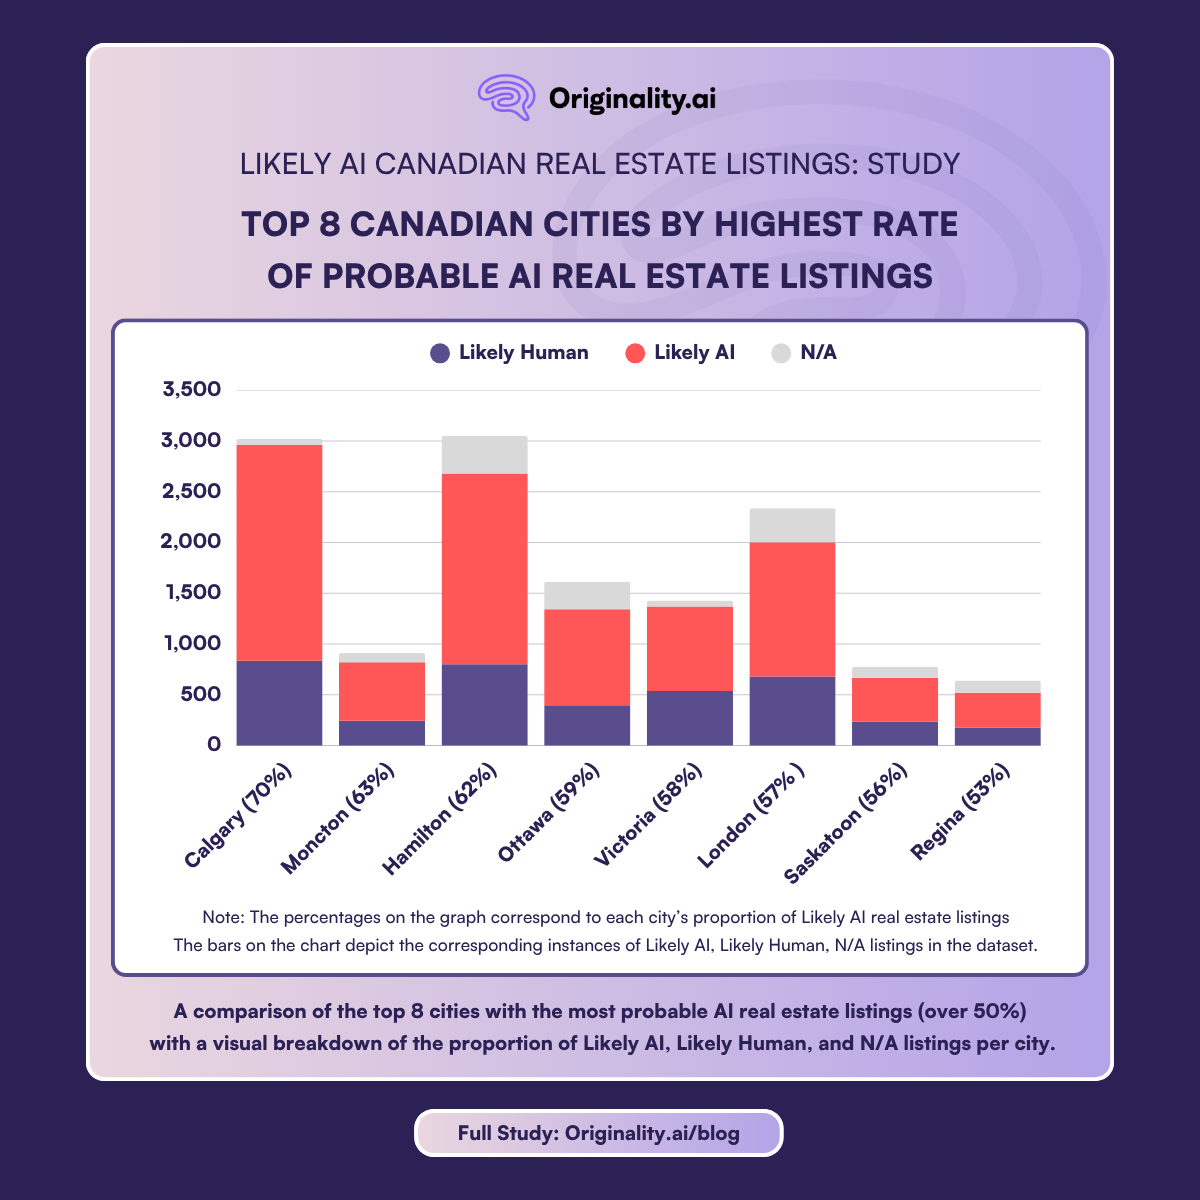
Setting aside Edmonton and Calgary, cities physically near each other tend to be closer in their results. Vancouver and Surrey slot in right next to each other, at 31% and 32%, respectively. Regina and Saskatoon are at 53% and 56%, also neighbours on the chart. Toronto (39%) and Mississauga (46%) have more daylight between them, but not much.
One variable appears to have no correlation on likelihood of AI listings: population.
Setting aside the Quebec outliers, the city with the lowest proportion of likely AI use is Vancouver, one of the most populous cities in Canada. But right there is Charlottetown, P.E.I.—one of the smallest sample sizes in our dataset—followed by firmly mid-sized Windsor, Ont. Conversely, the city with the second-greatest likelihood of using AI in their listings is Moncton, N.B., with all of 911 listings.
This could point to smaller sample sizes having greater swings, but the other cities with fewer than 1,000 listings (the two from Saskatchewan and St John’s, N.L.) are somewhere in the middle.
That being said, it is clear that the national average is being brought down by the relatively low likelihood of AI-written real estate listings in Canada’s three biggest cities: Toronto, Montreal, and Vancouver.
Even discounting Montreal (which accounts for nearly 15% of the entire dataset), Toronto and Vancouver—which together combine for a full 33% of all listings—both keep their AI likelihood scores under 40%. This has a significant impact on the overall picture, given that Toronto and Vancouver have been the two hottest real estate cities in the country for many years now.
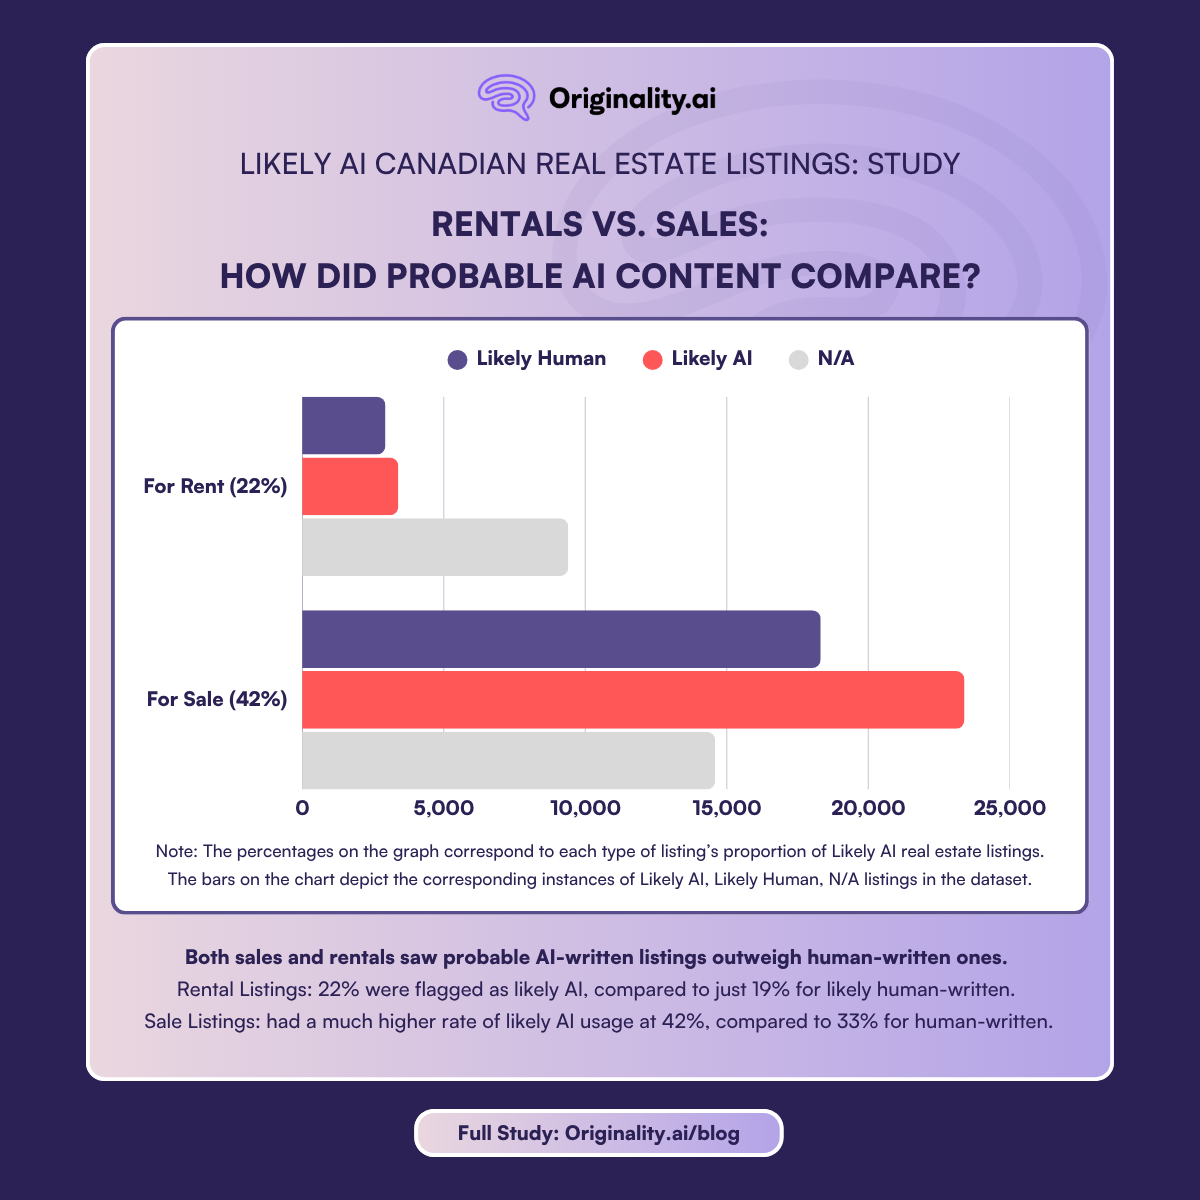
This dataset contains 15,735 rental listings and 56,312 sale listings. Both types of listings saw AI-written listings outweigh human-written ones.
Rentals contained far fewer usable descriptions—around two-thirds were too short for Originality.ai’s scan. But 22% of rental listings were flagged as likely written using AI, compared to just 19% for likely human-written content.
Sale listings had a much higher rate of likely AI usage at 42%, compared to 33% for human-written content.
Turning to cost, human-written listings were marginally more expensive than their likely AI-written counterparts in both rental and sale markets.
The average cost of a home being sold by an AI-generated description was $1,100,906, compared to $1,180,910 for a human-written one—a difference of almost exactly $80,000.
The margin for rentals was statistically negligible, with human-written listings averaging $3,037, compared to $2,997 for likely AI-written ones.
We analyzed every description to find some of the most commonly used adjectives in the dataset—language that is typically used to sell prospective buyers on the property.
LLMs tend to write in a style that mimics, and ultimately amplifies, human behaviour. It learns language from us, and then repeats those patterns back to us, to the point that the tells become obvious. Those patterns are clear when we look at the most common clichés and adjectives used in Canadian real estate listings.
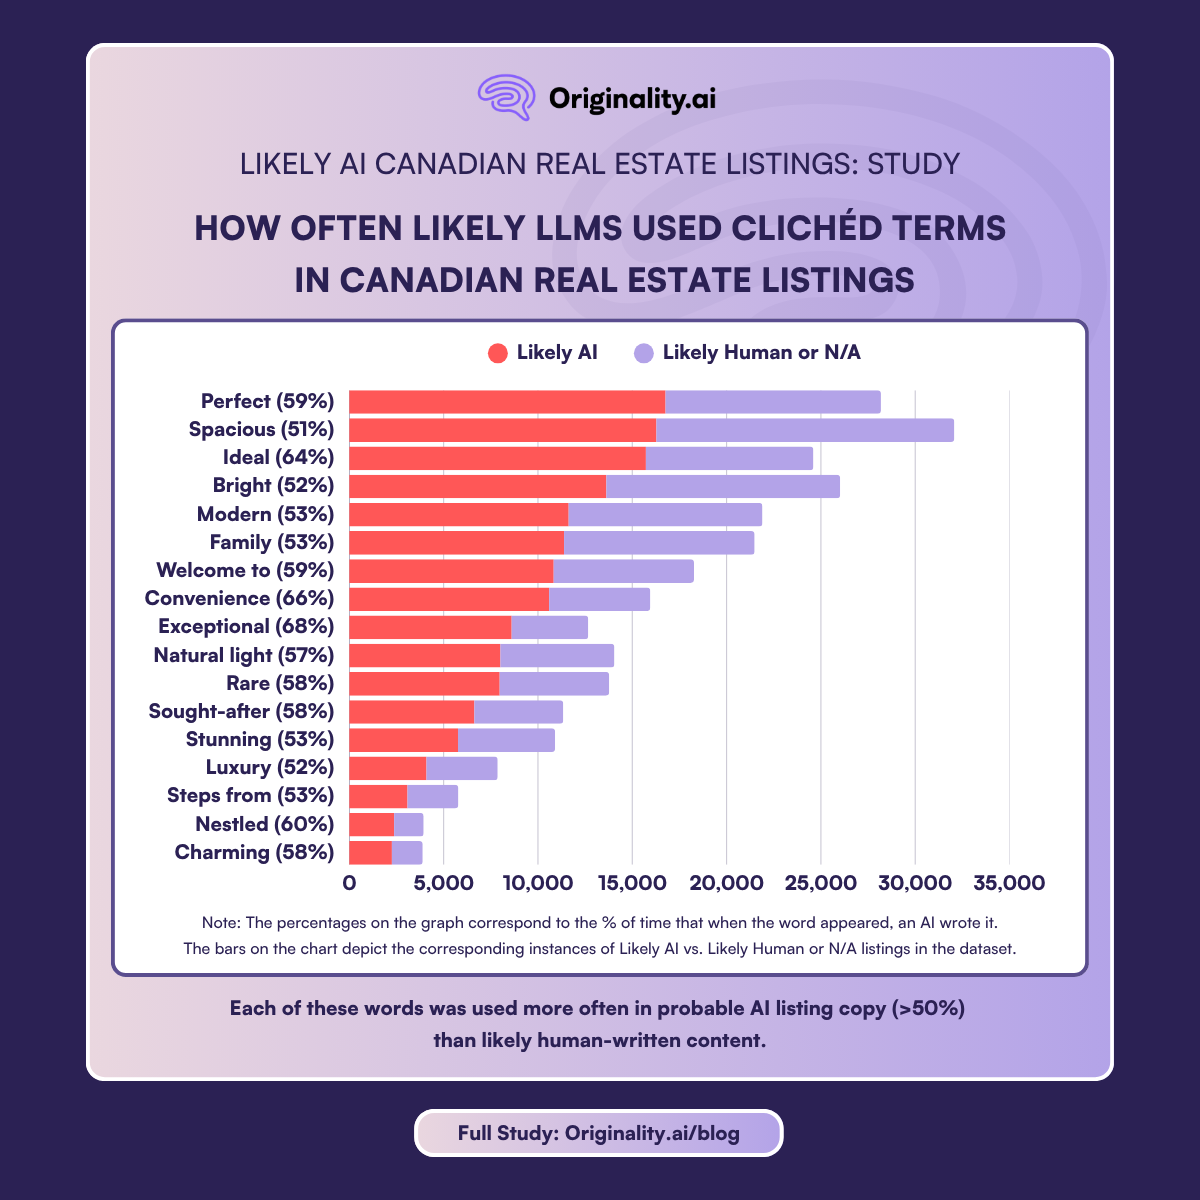
Each one of these words was used more often in listings likely written by AI (>50%) than human-written ones.
Human realtors use these terms as well, of course—just not as often. LLMs tend to stick with safe, neutral, predictable language.
Compare those numbers to a sample of less typical salesy words, like “dream”, “gorgeous” and “spectacular” (which are more emotive and casual) or “must-see”, “best” and “super” (LLMs try to avoid superlatives). All of those words appear more prominently in human-written listings.
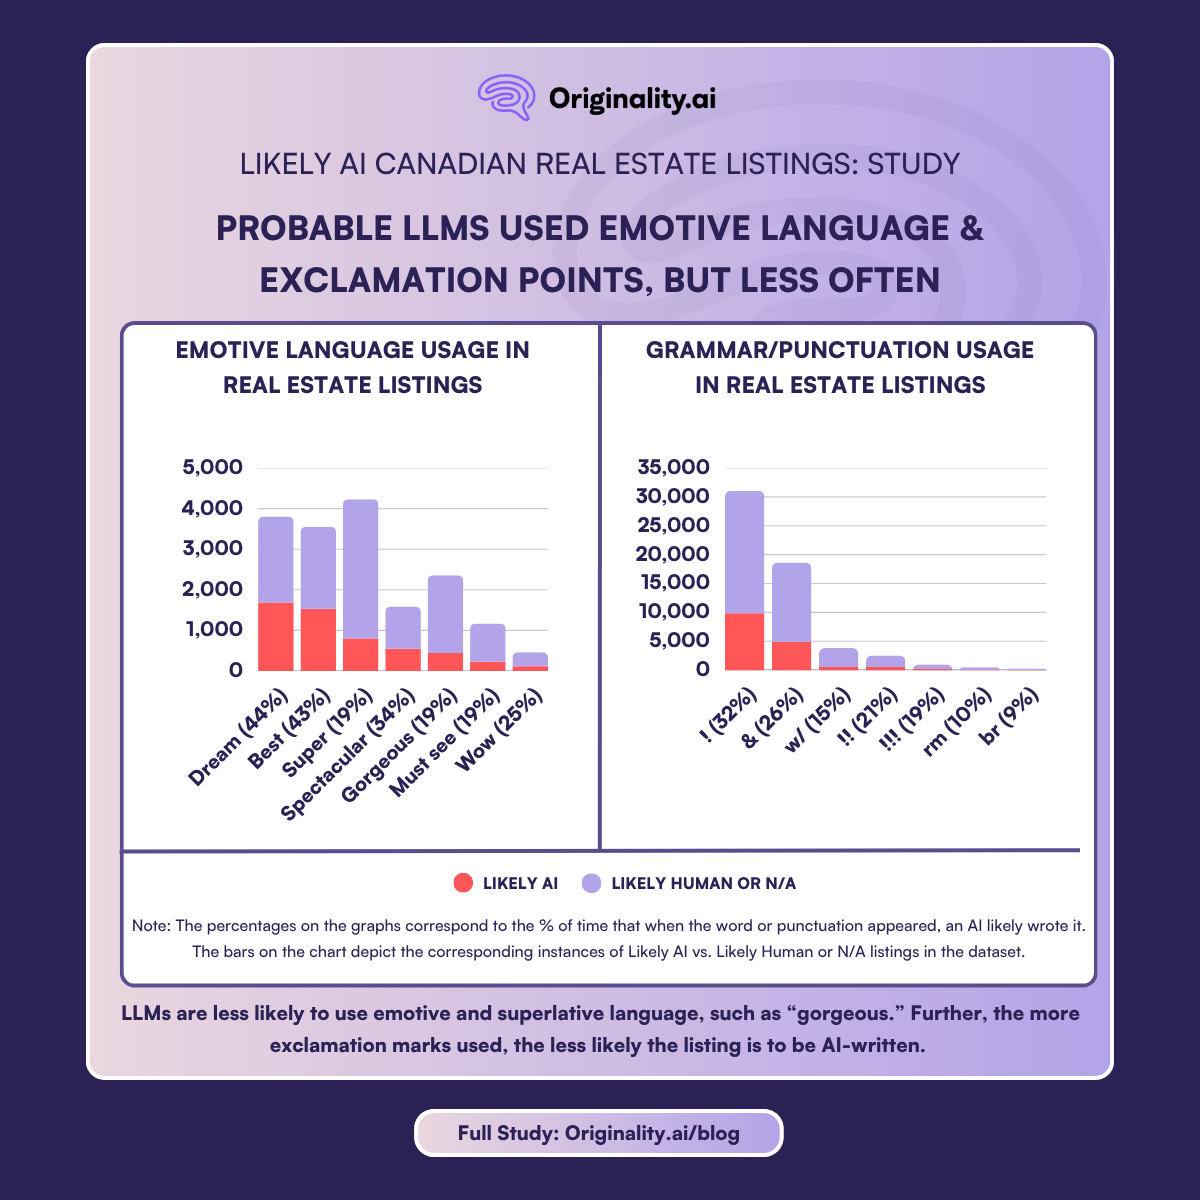
Grammar is a telling sign, also. There is a direct inverse relationship between the number of exclamation marks used and the likelihood of a listing being AI-generated. This likelihood correlates with the use of other shorthand text, such as ampersands, “w/” (“with”), “br” (“bedroom”) and “rm” (“room”), which were collectively used thousands of times in the dataset.
We did not analyze all-caps writing, but an anecdotal search through the descriptions confirms LLMs rarely use it—while excited humans certainly do.
For most Canadians, buying a house will be the biggest purchase of their lives.
Under ideal circumstances, homebuyers take significant due diligence: home inspections and neighbourhood assessments, investigations into local schools and zoning bylaws. Realtors use veiled language to disguise a property’s shortcomings—“fixer-uppers” mean renovations are required; “up-and-coming neighbourhood” is code for a gentrifying or lower-income area; “cozy” spaces are often crammed—but prospective buyers at least knew it was a human being trying to sell them on a place, and could read between the lines.
Now, nobody knows what’s happening on the other end of the screen. There are no disclosures around AI writing in real estate listings. The process Canadians use to make the biggest purchase in their lives is being quietly altered without their knowledge. As technology evolves, transparency and accountability should become paramount.
The Canadian Real Estate Association (CREA) blog, CREA Café, has a guide on how realtors can prompt AI to write real estate descriptions. In it, they note that realtors using AI should also consider potential privacy concerns and that AI is not perfect, so outputs must be verified.
Regional boards like the BC Financial Services Authority (BCFSA) also provide guidelines around the use of AI. For example, the BCFSA emphasizes that realtors cannot make false representations of a space. In practice, they note that as AI evolves, they acknowledge that realtors can show the potential of a home by adding AI-generated furnishings to their listing photos, but cannot alter reality (for example, using AI to make broken floors, cracked walls or other defects disappear).
In our dataset, 37 listings included AI disclosures for altering photos—0.05% of the data.
The regulatory boards researched for this study generally permit AI-generated text with no required disclosures; however, realtors are liable for any false claims made within the text.
It is unclear whether any realtor has been penalized for copying and pasting LLM text without reviewing it first, despite a few embarrassing instances being mocked online.
No listings in our dataset included any disclosures about using AI to write their listings.
AI has emerged as a tool to improve workflows in a myriad of industries. But in emotional, high-stakes, public-facing fields like real estate, professionals would be wise to keep humanity at the forefront.
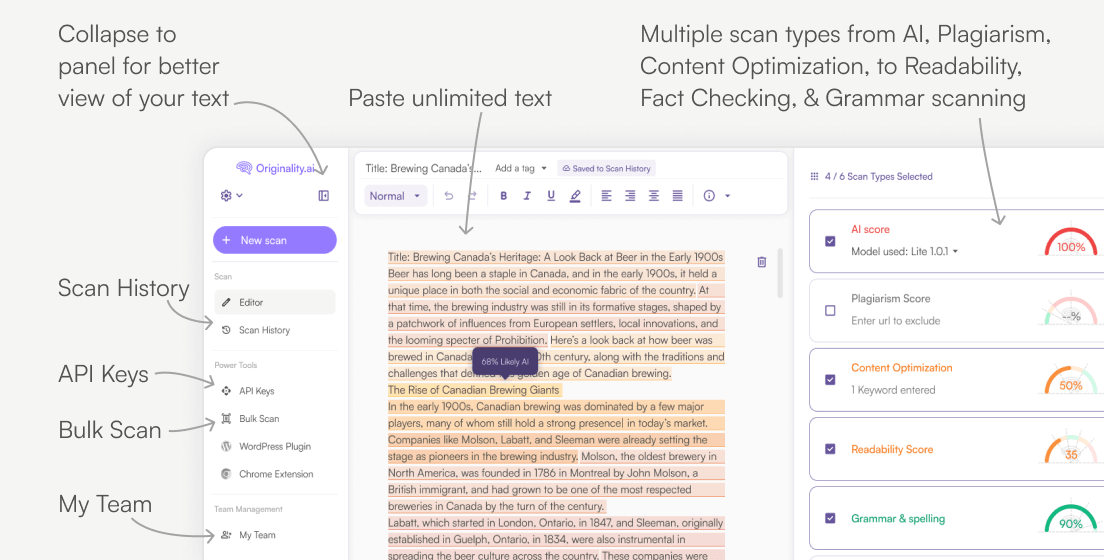
Think the real estate listing you’re reading might be AI? Use Originality.ai to find out.
This study analyzed active Canadian real estate listings to determine the prevalence of AI-generated description text across major urban markets. Listing data was collected via automated web scraping, descriptions were scanned using an AI detection tool, and results were analyzed in Microsoft Excel.
Listing data was sourced in the first two weeks of May 2026 from Realtor.ca, Canada’s national MLS database, operated by the Canadian Real Estate Association (CREA). Data was accessed programmatically via the Realtor.ca Scraper API, a third-party API available through RapidAPI by ScrapeMind, which provides structured access to Realtor.ca's property search and listing detail endpoints.
A custom Python 3 scraping pipeline was developed consisting of city-specific scripts, each built from a common template. The pipeline first searched for the /properties/search endpoint using geographic bounding box parameters (latitude/longitude min/max), derived directly from Realtor.ca’s own map interface for each target city. To ensure complete coverage within each market, cities were divided into spatial grids of between 1x1 and 6x6 cells, depending on listing density, with each cell queried independently. Results were paginated at 12 listings per page until no further results were returned.
After collecting each MLS number in the first stage of the pipeline, the /properties/details endpoint was queried individually to retrieve the full listing description (the PublicRemarks field), along with supplementary fields including property type, price and address. All data was written incrementally to a city-specific SQLite database file, with each listing committed immediately upon retrieval to prevent data loss in the event of interruption.
Data was collected across 20 Canadian cities spanning all major regions—Toronto, Montreal, Vancouver, Mississauga, Surrey, Hamilton, Edmonton, Calgary, Quebec City, London, Winnipeg, Ottawa, Victoria, Halifax, Windsor, Moncton, Saskatoon, St. John’s, Charlottetown and Regina—resulting in 72,047 listings collected in total, representing active for-sale and for-rent listings as of May 2026. Approximately 100,000 API calls were consumed across the full data collection effort.
Listing descriptions were scanned using Originality.ai. Each scannable description received a probability score from 0 to 100, with results classified as “Likely AI” (score ≥ 50) or “Likely Human” (score < 50). Listings with descriptions below the word threshold were retained in the dataset and classified as N/A.

AI & Plagiarism Detector for Serious Content Publishers
Originality.ai
64 Hurontario St
Collingwood, Ontario
L9Y 2L6